The useful question is not “is there an anomaly?”
For operations, an anomaly by itself is only a signal. The more useful question is which machine deserves attention first and why. I built the reference flow around that operating decision.
Build a simple Bronze / Silver / Gold flow
The dataset contains 48 hours of simulated temperature, vibration, pressure and runtime readings across 20 machines. Bronze keeps the raw data, Silver applies validation and cleaning, and the later processing aggregates machine behaviour into operational features and risk.
Turn readings into machine-level risk
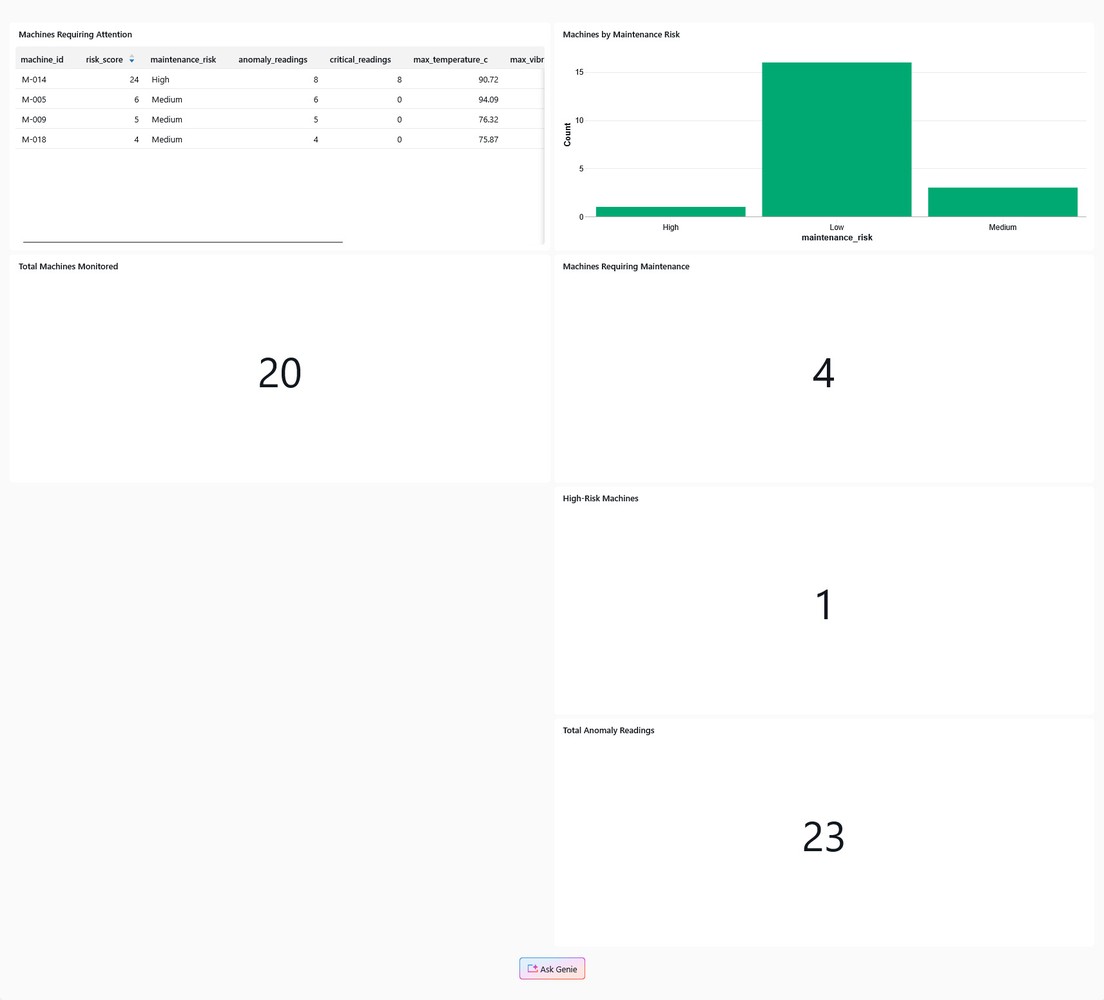
Anomaly logic identifies unusual readings, then machine-level aggregation produces a risk score and maintenance recommendation. In the sample run, 23 anomaly readings resulted in four machines requiring attention, with one classified as high risk.
Design the dashboard around action
The Gold output and SQL dashboard focus on the machines requiring attention, the risk distribution and the metrics needed to explain the priority. The objective is to help someone decide where to look first.
Delivery lessons
- Raw telemetry and operational priority are different products.
- Data quality checks belong before risk logic.
- Risk scoring should be explainable enough to support an action.
- Dashboards are more useful when they lead with exceptions rather than averages.
Related work
This reference implementation is based on simulated sensor data, but the delivery pattern is the important part: move from telemetry to a governed pipeline, then from signals to an explicit operational action.
See selected projects →